Part 3: TDAG Explorer
In the previous two parts we learned how can we easily build and schedule Time Series Pipelines now lets see how can we monitor , manage and explor them in a unified web interface.
TDAG Enterprise gives you access to complete GUI for observability in this GUI you can:
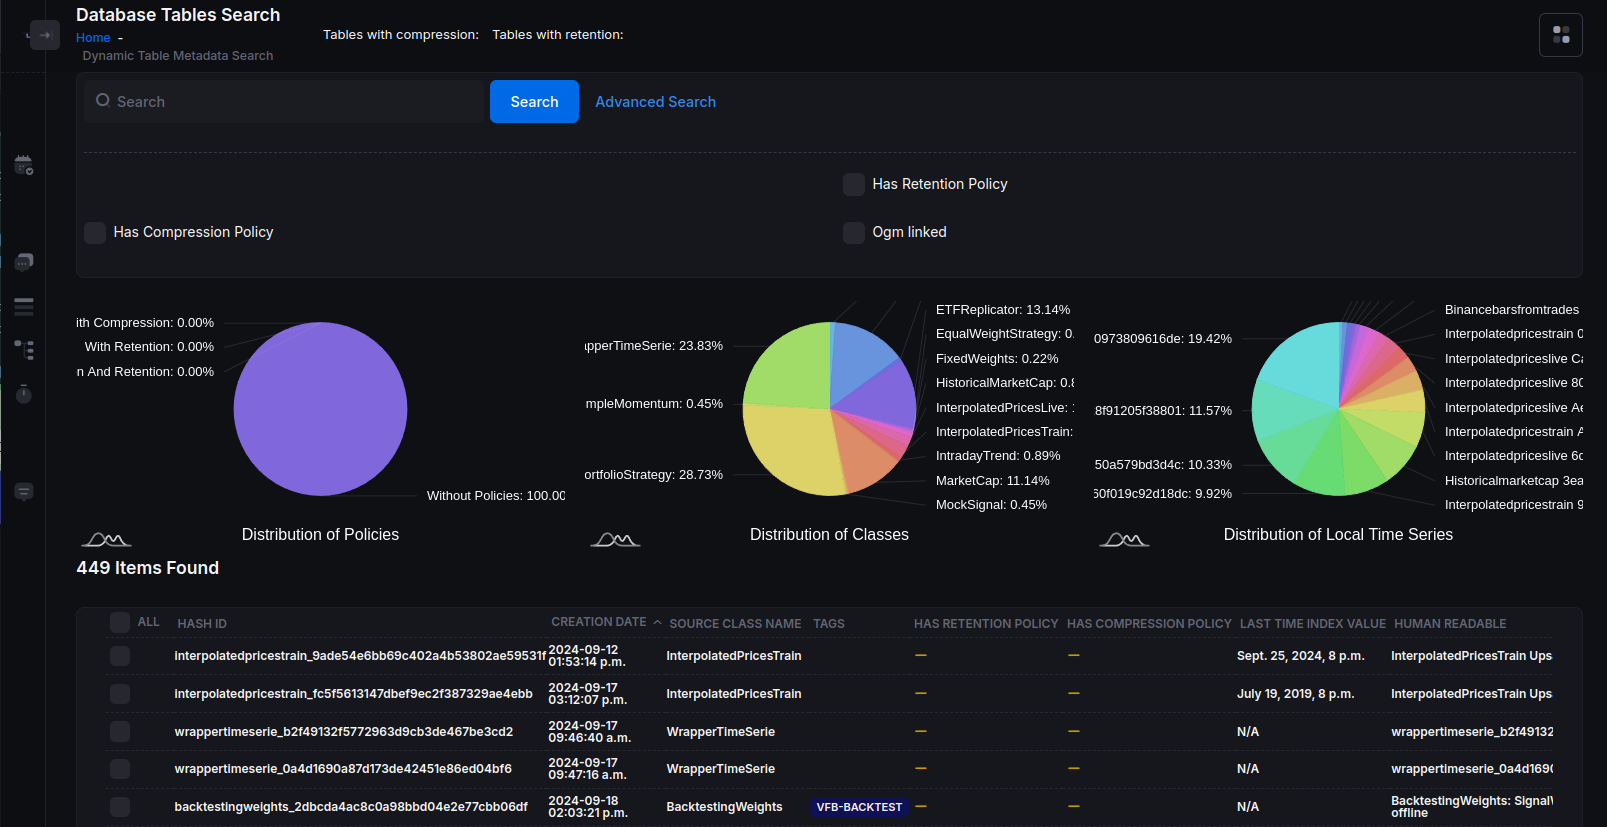
1 Search and visualize your tables by type of pipeline
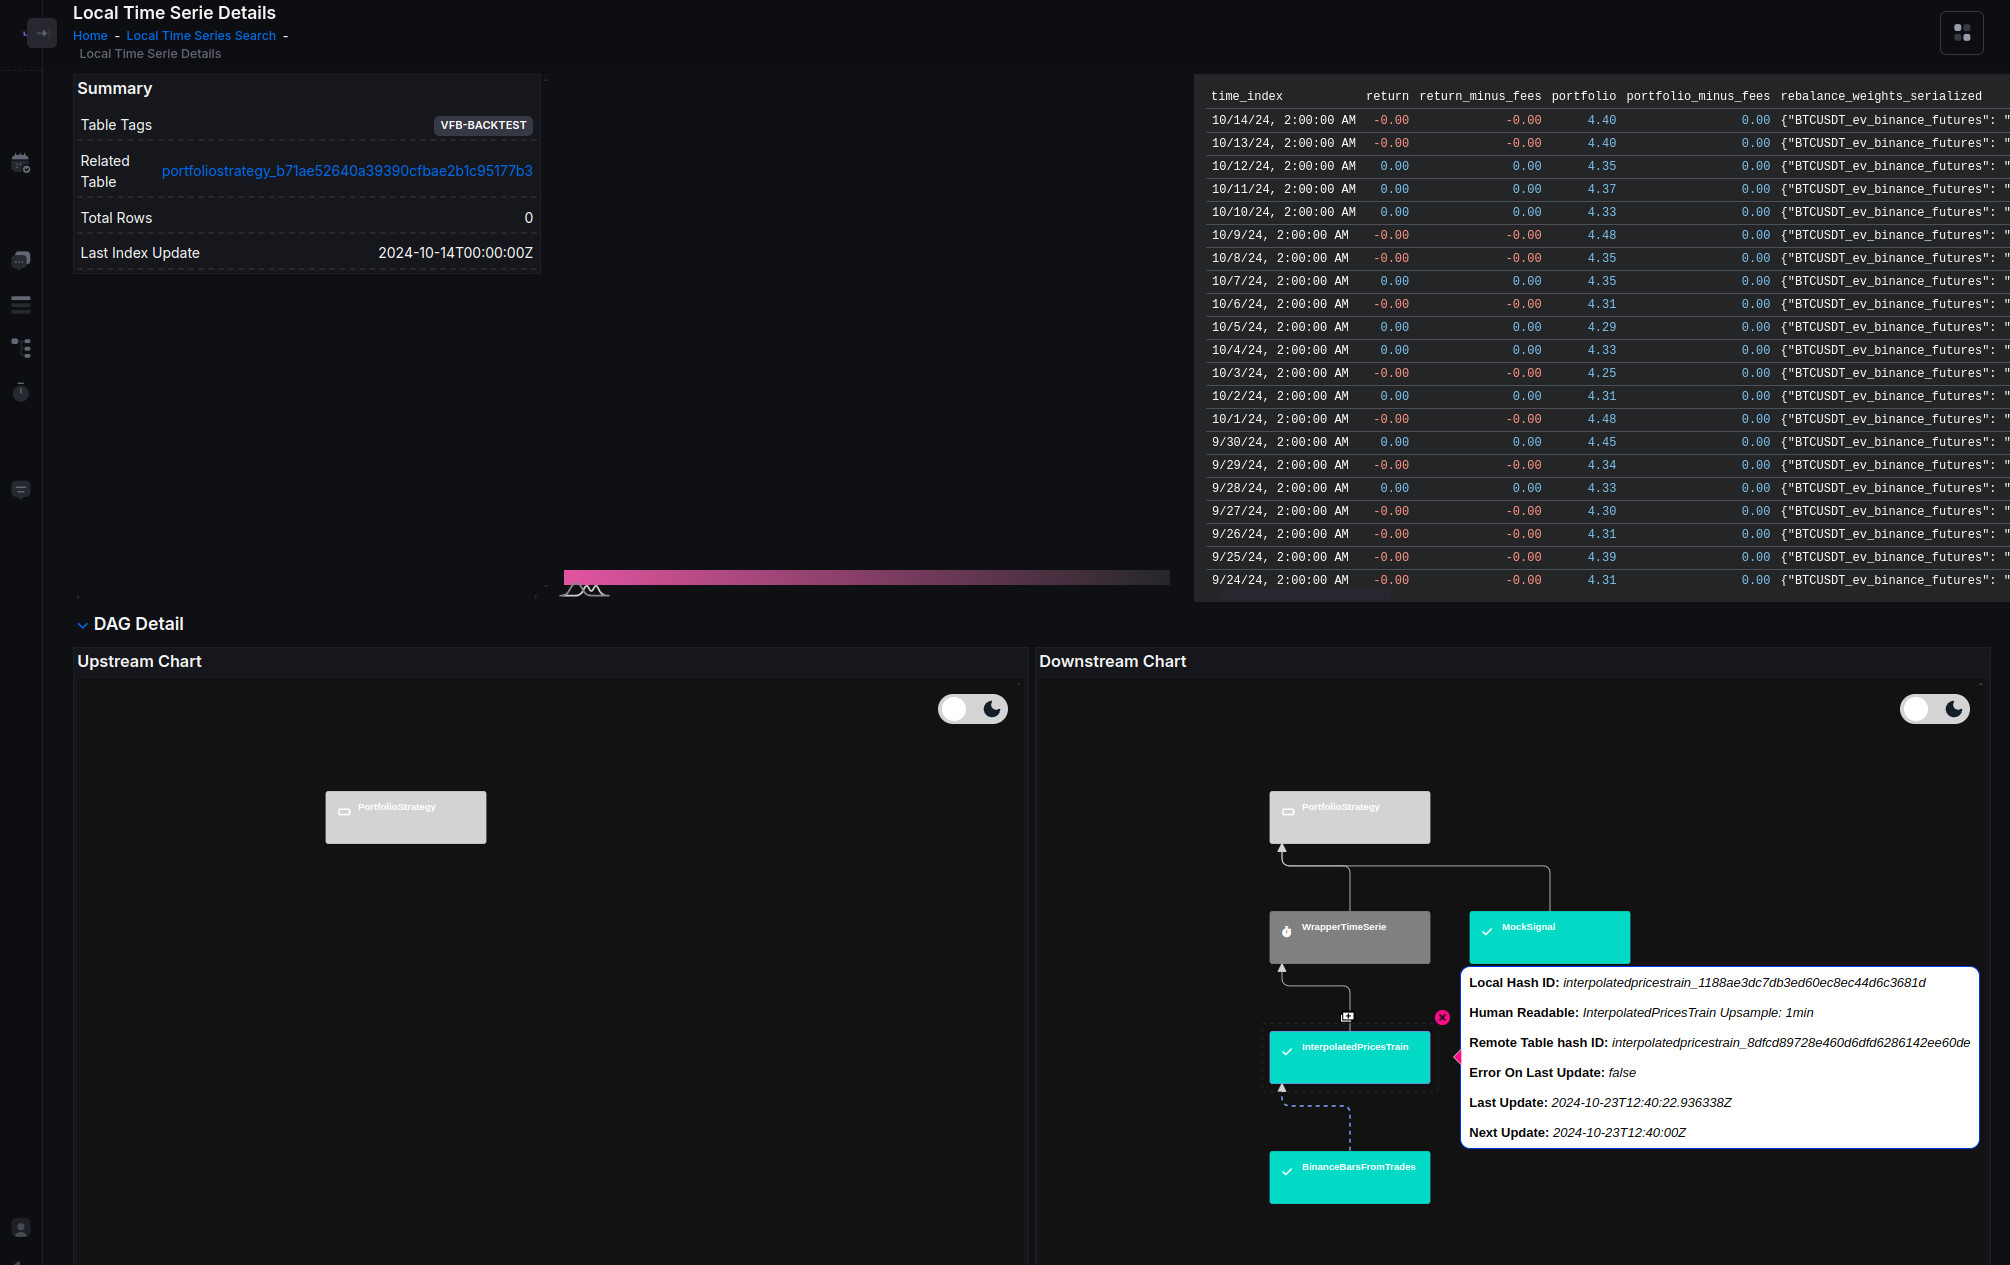
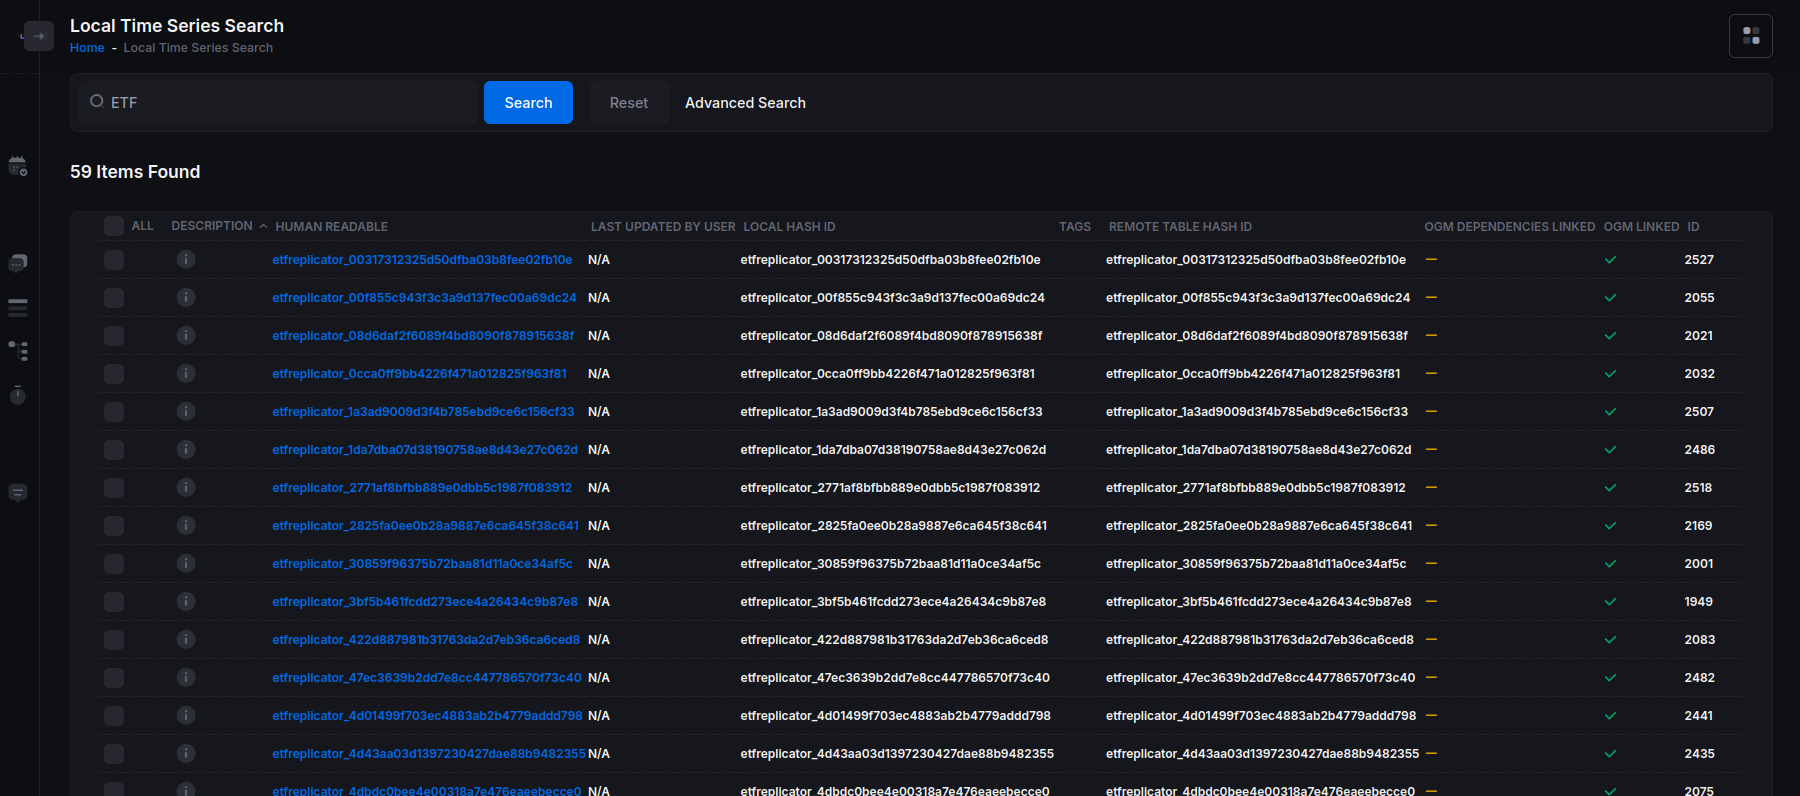
2 Search and visualize your Time Series Processes
Search
Visualize its build and update detail